Understanding Geolocations and Their Connection to Data Quality

By Richa Gautam, Miriam Kerstein, MS, Aaron Moss, PhD, & Leib Litman, PhD
Highlights:
- Amid the Bot Scare on MTurk in the summer of 2018, researchers reported that bad data often came from respondents linked to repeated geolocations.
- However, a deeper understanding of geolocations suggests there is little reason to believe that repeated geolocations are inherently tied to bad data quality.
- We describe the difference between repeated geolocations that come from server farms and those that do not and we test the quality of data from the top 200 repeated geolocations not tied to server farms.
- Repeated geolocations that are not tied to server farms were a source of high-quality data and compared to data obtained from non-repeated geolocations.
- Based on these results, we believe duplicate geolocations are not inherently problematic. Further, we are adjusting the default setting of our Block Duplicate Geolocations Feature to “OFF” and adding a pop-up to inform researchers about the consequences of using this tool.
In this blog, we outline the history of our Block Duplicate Geolocations tool, provide an overview of what geolocations are and the information they convey, and present the results of a study that examined the quality of data obtained from repeated geolocations that are not linked to server farms. We conclude by outlining the steps we are taking to change the default options on our Block Duplicate Geolocations feature.
History of the Block Duplicate Geolocations Tool
In August 2018, we introduced two tools in response to the Bot Scare on MTurk. The first tool, our Block Suspicious Geolocations feature, blocked submissions from suspicious locations we later identified as server farms. Since August, we have implemented a protocol to continually identify server farms and add them to our list of blocked locations. The second tool we created, our “Block Duplicate Geolocations” feature, prevented multiple workers from the same geolocation from submitting a HIT in the same study. The Block Duplicate Geolocations tool was intended as a secondary security feature in case: a) our list of server farms was not comprehensive, or b) researchers wanted to be extra cautious in their data collection.
Since launching the Block Duplicate Geolocations tool, we have conducted internal research to identify whether multiple submissions from the same geolocation are inherently tied to low-quality data. Even before launching the tool, we had reasons to believe duplicate geolocations are only problematic if they are tied to server farms. Because geolocation reporting services provide only a rough estimate of worker location and because many workers can be pinned to the same geolocation by circumstance or by default, we wanted to investigate if and when repeated geolocations are associated with data quality.
Two Types of Repeated Geolocations
Repeated geolocations may appear in a dataset for one of two reasons. First, when workers use a VPN or other tools to mask their IP address and location, they may be pinned to a server farm. As happened in the summer of 2018, when many workers use a VPN to route their traffic through server farms, repeated geolocations will be associated with low-quality data. The second reason repeated geolocations may appear in a dataset is if workers in somewhat close proximity to each other complete studies on MTurk. Repeated geolocations that are not from server farms are unlikely to be associated with data quality problems. To understand why it helps to first know what geolocations are and how they are determined.
What are Geolocations?
Geolocations, or geocodes, are latitude-longitude pairs that estimate a worker’s location. Survey platforms like Qualtrics include an estimate of each participant’s location along with the participants’ recorded data. The location estimates provided by platforms like Qualtrics are obtained via third-party services that map Internet Provider (IP) addresses to physical locations.
The first thing to know about geolocations is that they are inexact; a latitude-longitude pair doesn’t tell you exactly where someone is. Rather, it provides an estimate of their location (see Hill, 2016, for a quality and essential read regarding the accuracy of geolocations). To interpret this estimate, you need to look at the accuracy radius, which conveys that the participant is within a radius of x kilometers from the given latitude-longitude point. While services like Qualtrics add latitude and longitude coordinates to your data file, they do not include the accuracy radius, which is essential for understanding the estimate.
To make this idea more clear, consider Figure 1. Figure 1 displays a geolocation in Cheney, Kansas—a small town of about 2,000 people. Also, shown on the map is a shaded area representing the accuracy radius. In this case, the accuracy radius is 50 kilometers (about 30 miles). While the median accuracy radius reported by our geolocation service for all studies completed through our platform is 20 kilometers (12 miles), accuracy radii can be as high as 500 or even 1,000 kilometers (over 600 miles).
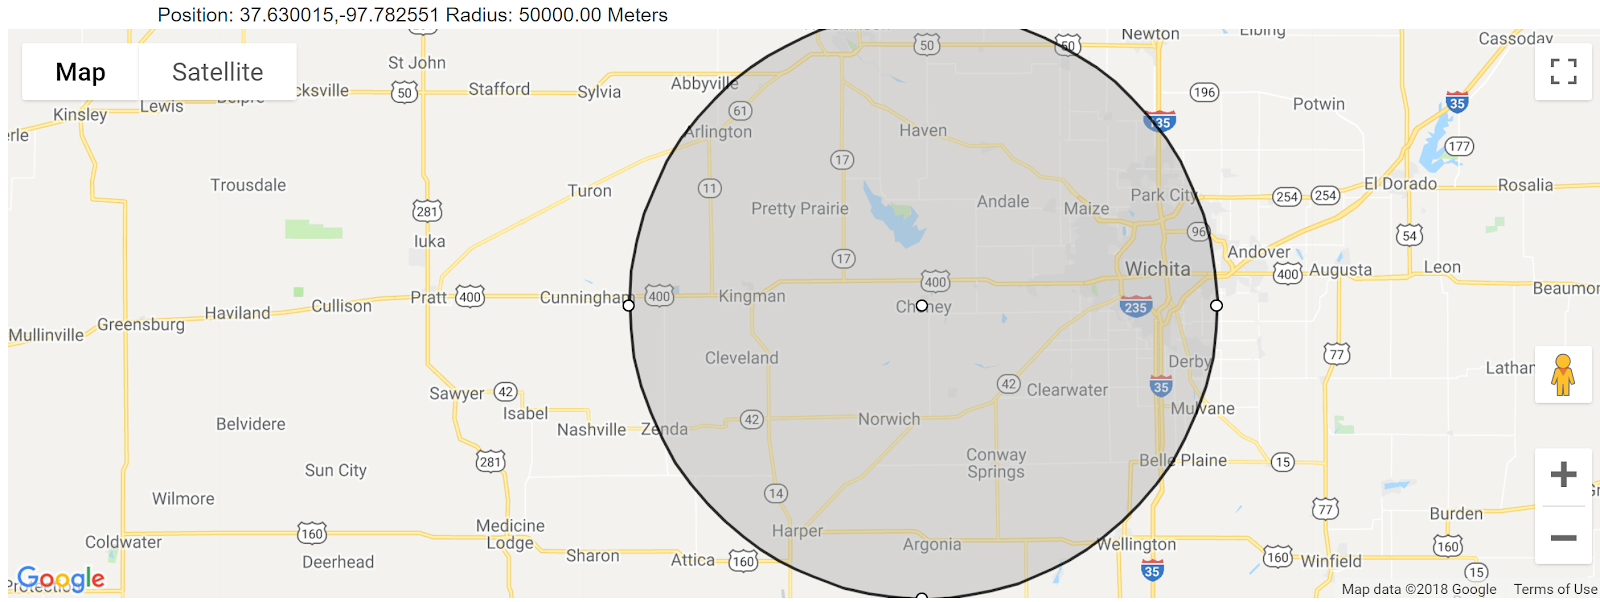
A worker presenting with the latitude longitude pair for Cheney, Kansas and an accuracy radius of 50 kilometers, could actually be in nearby towns like Haven, Pretty Prairie, Kingman, Cleveland, Norwich, Harper, or Argonia, among other places. If two workers present with the same geocode data, one might be in Maize and one might be in Kingman, which are entirely separate and distant locations.
Knowing that geolocations are imprecise and vary in terms of accuracy, it calls into question whether repeated geolocations that are not tied to server farms should be used to make judgments about data quality. Below, we report a study that investigated data quality from 200 repeated geo-locations that are not tied to server farms.
Study to Assess Data Quality
As stated above, geolocations are not inherently tied to data quality. The locations we know are tied to poor quality data (i.e, server farms) are blocked by our Block Suspicious Geolocations tool. To understand how necessary our Block Duplicate Geolocations tool is for quality data, we ran a study that examined data quality from the top 200 locations we see multiple submissions from.
Method
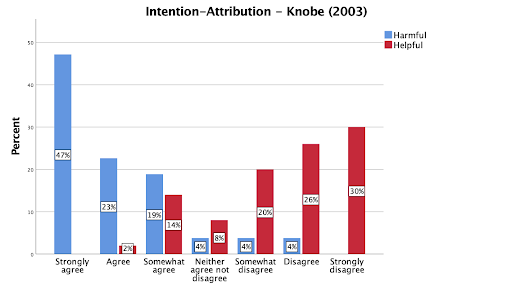
We sampled 100 workers from the top 200 locations where we see multiple submissions. In the study, workers completed validated scales including the Big Five Inventory (BFI), the Eating Attitudes Test (EAT) and the Intellectual Humility Scale (IHS). They then responded to two experimental manipulations recently used in the Many Labs 2 project: the Intentional Action and Side Effects in Ordinary Language task (Knobe, 2003) and Assimilation and Contrast Effects in Part-Whole Question Sequences: A Conversational Logic Analysis (Schwarz, Strack & Mai, 1991, Study 1). We chose experiments that showed a strong effect size when replicated (Knobe, 2003) and one that failed to replicate (Schwarz, Strack & Mai, 1991, Study 1) to see if our duplicate geolocations sample yielded the same results as the much bigger and more diverse sample of Many Labs 2.
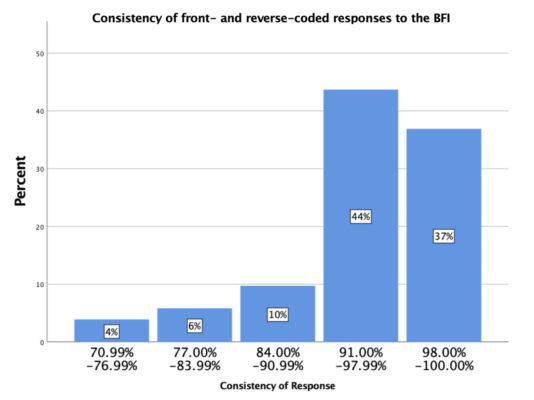
To assess data quality, we examined reliability coefficients for all scales, squared discrepancy scores for the BFI, and whether the experiments that should have replicated, did replicate. The Squared Discrepancy Procedure examines how consistently participants respond to forward and reversed questions (e.g. “I tend to be organized” vs. “I tend to be disorganized”). The measure yields a number, expressed as a percentage, to describe how consistently participants respond to reversed items. Seventy-five percent is the clear cutoff for random responding (see Litman, Robinson, & Rosenzweig, 2015).
Results
We observed good internal reliability for the BFI subscales.
Table 1. Cronbach alphas for the Big Five Factors
SDP scores for the BFI were also good, indicating that the vast majority of participants responded consistently during a long task that required sustained attention (Figure 2).
Consistent with the literature on the reliability of the EAT subscales (Weinberger-Litman et al), we found high internal reliability for the Dieting, and Bulimia & Food Preoccupation subscales and moderate reliability for the Oral Control subscale.
Table 2. Cronbach alphas for the three Eating Attitudes Test subscales
We found high internal reliability for all four subscales of the IHS.
Table 3. Cronbach alphas for the four Intellectual Humility Scale subscales
The intentional action study replicated as expected (Knobe, 2003). Participants thought an action was more intentional when it was harmful than helpful.
Based on Many Labs 2, we did not expect to find a significant effect for the Schwarz, Strack, and Mai (1991) study. The analysis indicated no significant difference in correlation co-efficients (calculated using Vassar Stats; see Table 4) for the assimilation and contrast effects (p > .05).
Table 4. Fisher-to-Z transformation for correlation coefficients (Schwarz, Strack & Mai, 1991, Study 1)
Conclusions
Our results reveal that bad data quality is not tied to repeated geolocations when those geolocations are not mapped to server farms. Workers from repeated geolocation that were not server farms provided quality data similar to what we collected in previous studies examining data quality from non-repeated geolocations (see here and here). Despite our evidence, we realize some researchers may still be cautious given the data quality issues that occurred over the summer. Therefore, we have decided to keep the Block Duplicate Geolocations feature as an option, but to set it to OFF by default. When a requestor turns the feature on, they will receive a pop-up message outlining the scope of the feature, the impact of the feature on data quality, and a link to this blog.
Further, we want to emphasize that bad data does not come from geolocations, but from specific workers. We have several tools that make creating a list of workers to exclude from your studies easy and efficient.
We hope this blog post clarifies the nature of geolocations and how the Block Duplicate Geolocations tool operates. We encourage requesters to weigh the pros and cons of this feature before deciding to use it.
References
Gautam, R.*, Kerstein, M.*, Moss, A. J.*, & Litman, L. (2018, Dec. 12). Understanding Geolocations and Their Connection to Data Quality [blog post]. Retrieved from https://www.cloudresearch.com/resources/blog/understanding-geolocations-and-their-connection-to-data-quality/
*Equal Contribution
Hill, K. (2016, May 14). How an internet mapping glitch turned this Kansas farm into digital hell. Retrieved from: https://theweek.com/articles/624040/how-internet-mapping-glitch-turned-kansas-farm-into-digital-hell
Klein, R. A., Vianello, M., Hasselman, F., Adams, B. G., Adams, R. B., Alper, S., . . . Friedman, M. (2017). Many Labs 2: Investigating variation in replicability across sample and setting. Unpublished manuscript. Retrieved from https://osf.io/8cd4r/
Knobe, J. (2003). Intentional action and side effects in ordinary language. Analysis, 63, 190-194. https://www.jstor.org/stable/3329308
Litman, L., Robinson, J., & Rosenzweig, C. (2015). The relationship between motivation, monetary compensation, and data quality among US and India-based workers on Mechanical Turk. Behavior Research Methods, 47, 519-528. https://doi.org/10.3758/s13428-014-0483-x
Schwarz, N., Strack, F., & Mai, H. P. (1991). Assimilation and contrast effects in part-whole question sequences: A conversational logic analysis. Public opinion quarterly, 55, 3-23. https://doi.org/10.1086/26
Weinberger-Litman, S. L., Rabin, L. A., Fogel, J., Mensinger, J. L., & Litman, L. (2016). Psychosocial mediators of the relationship between religious orientation and eating disorder risk factors in young Jewish women. Psychology of Religion and Spirituality, 8, 265-276. http://dx.doi.org.libproxy.tulane.edu:2048/10.1037/a0040293
Share this blog